GeoPrior-3.0 Forecaster
A guided desktop environment for operationalizing GeoPrior-v3 from data intake to reproducible geohazard forecasting.
- 19
- interface screens
- 4
- core workflow stages
- 1
- desktop layer over GeoPrior-v3
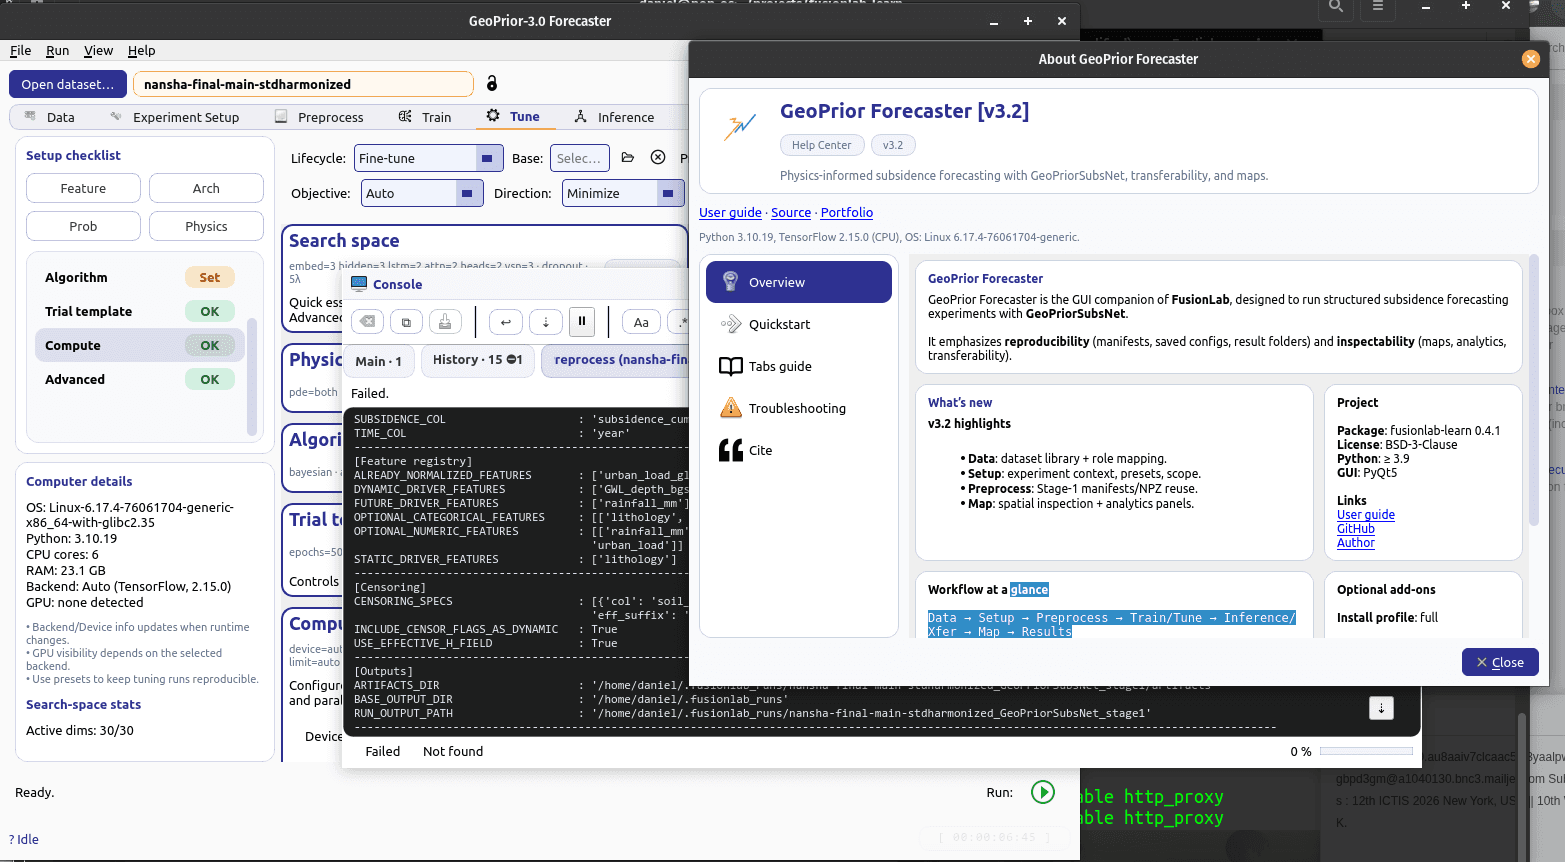
See it in action
Watch GeoPrior-3.0 Forecaster project land subsidence to 2032, then follow the full workflow and how a model trained in one city transfers to another.

Land subsidence simulation
A short visual simulation showing how land subsidence could evolve from 2020 to 2032 under a business-as-usual scenario, helping decision-makers see where risk concentrates and why early action matters.
Watch on YouTube Tutorial
GeoPrior-v3 tutorial walkthrough
A deeper walkthrough of the forecasting workflow, from guided setup to model execution inside the desktop product experience.
Watch on YouTube Deep diveIn French
Transferability across cities
A focused explanation of how a model trained in one city can support another city instead of forcing every deployment to restart from zero.
Watch on YouTube
Built for real forecasting work
Every assumption, physics setting and model choice stays in view, so results are easier to trust, review and share.
Who it is for
- 1Research labs that want reproducible setup without command-line friction.
- 2Applied geohazard teams preparing land-subsidence scenarios and transfer runs.
- 3Project leads who need model assumptions, physics settings, and outputs visible in one place.
Guided setup surfaces
Move through project paths, coordinate systems, data semantics, scaling, and feature registration with explicit UI checkpoints.
Physics-aware configuration
Keep architecture settings, censor-aware thickness handling, and physics constraints visible instead of hidden in scripts.
Operational workflow tabs
Data, experiment setup, and preprocessing views keep the end-to-end forecasting pipeline legible for teams.
Transfer and tuning ready
Support repeated experiments, model tuning, and transfer workflows in a desktop-first product layer.
From raw data to forecast in four steps
A guided path that keeps every setting visible, from the first dataset to the final forecast.
- 1
Ingest and align data
Start from project paths, coordinate reference systems, and semantic setup so every run begins from a clean contract.
- 2
Design the experiment
Define time windows, scaling units, feature registries, and architecture settings from dedicated setup dialogs.
- 3
Apply preprocessing controls
Handle censoring, physics constraints, and device/runtime options before training begins.
- 4
Train, tune, and forecast
Run forecasting workflows with a UI that keeps probabilities, experiment state, and decision points visible.
Inside the application
Three core workspaces: explore your data, design the experiment, and control preprocessing.
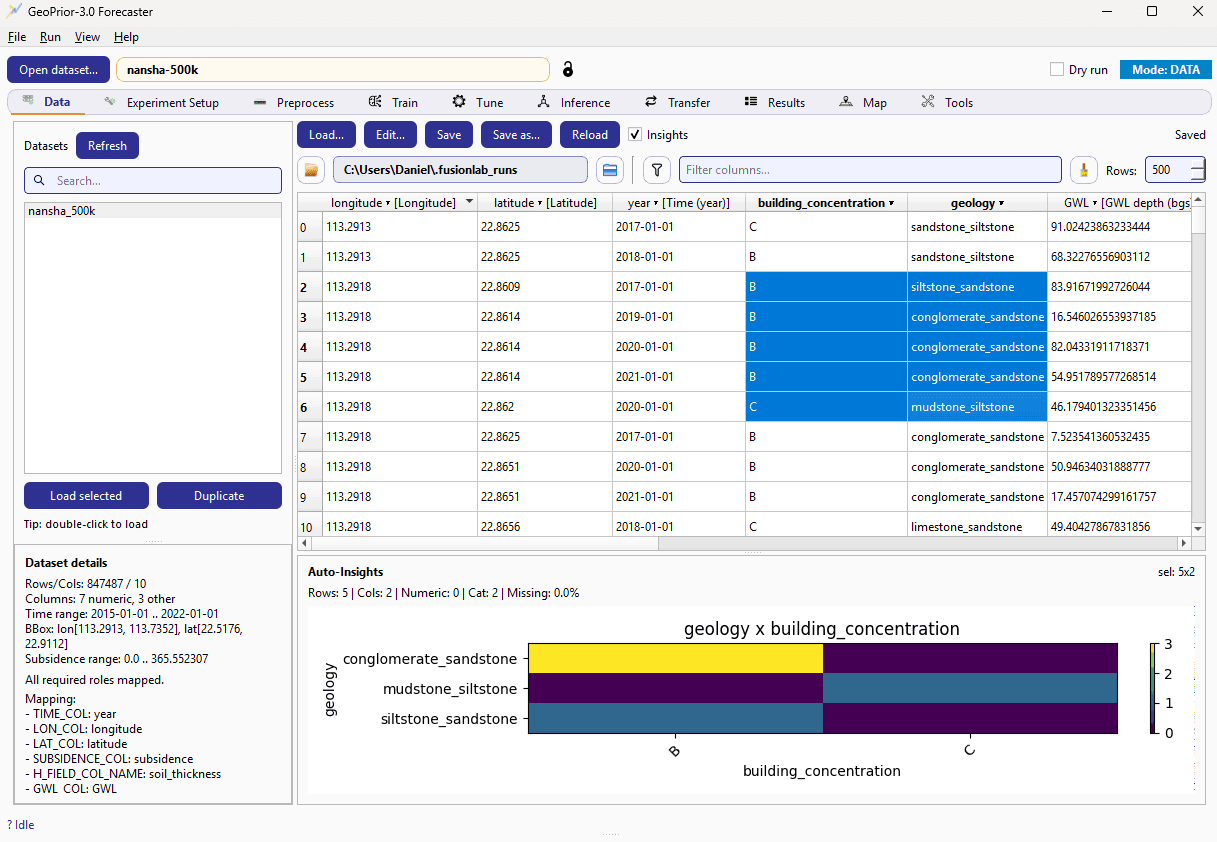
Data workspace
Load a city dataset, inspect every column, and read automatic insights before any modelling starts.
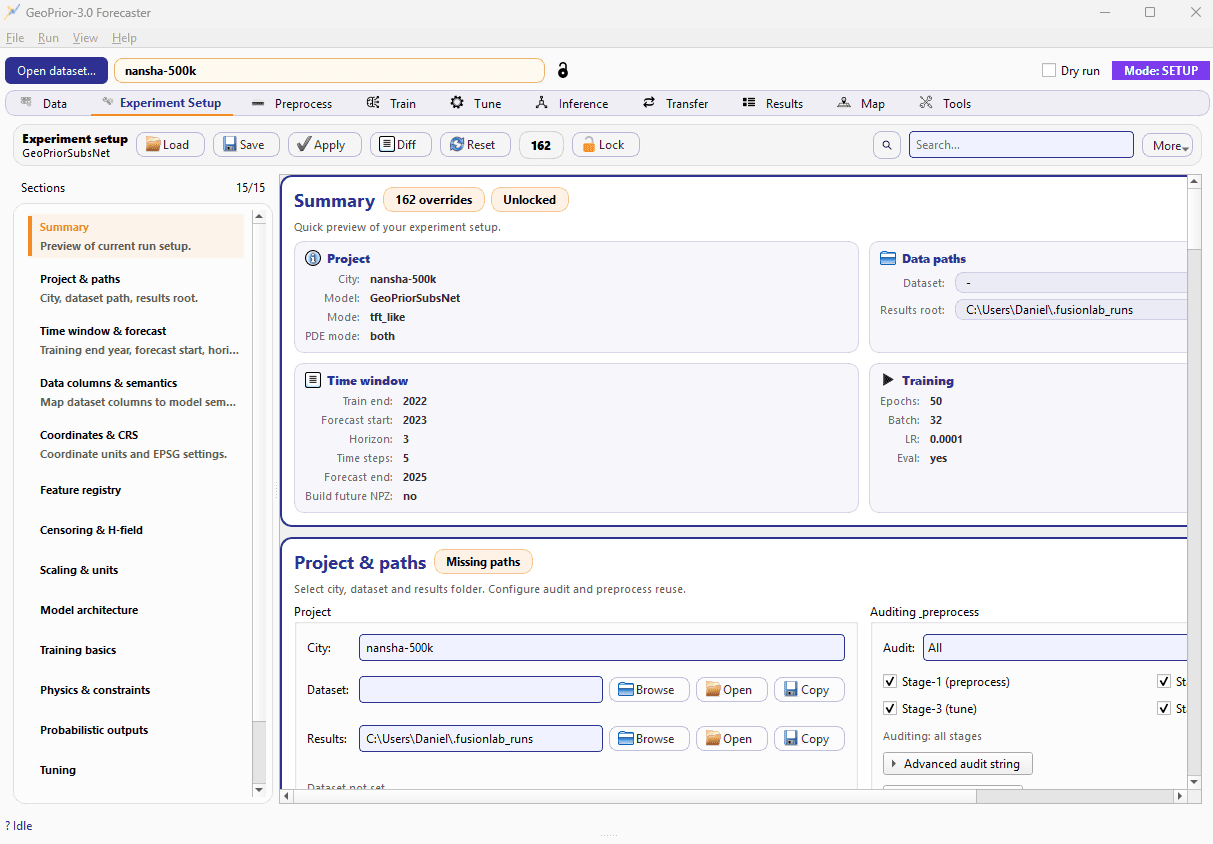
Experiment design
A dedicated setup view for architecture, time windows, feature choices, and run definition.
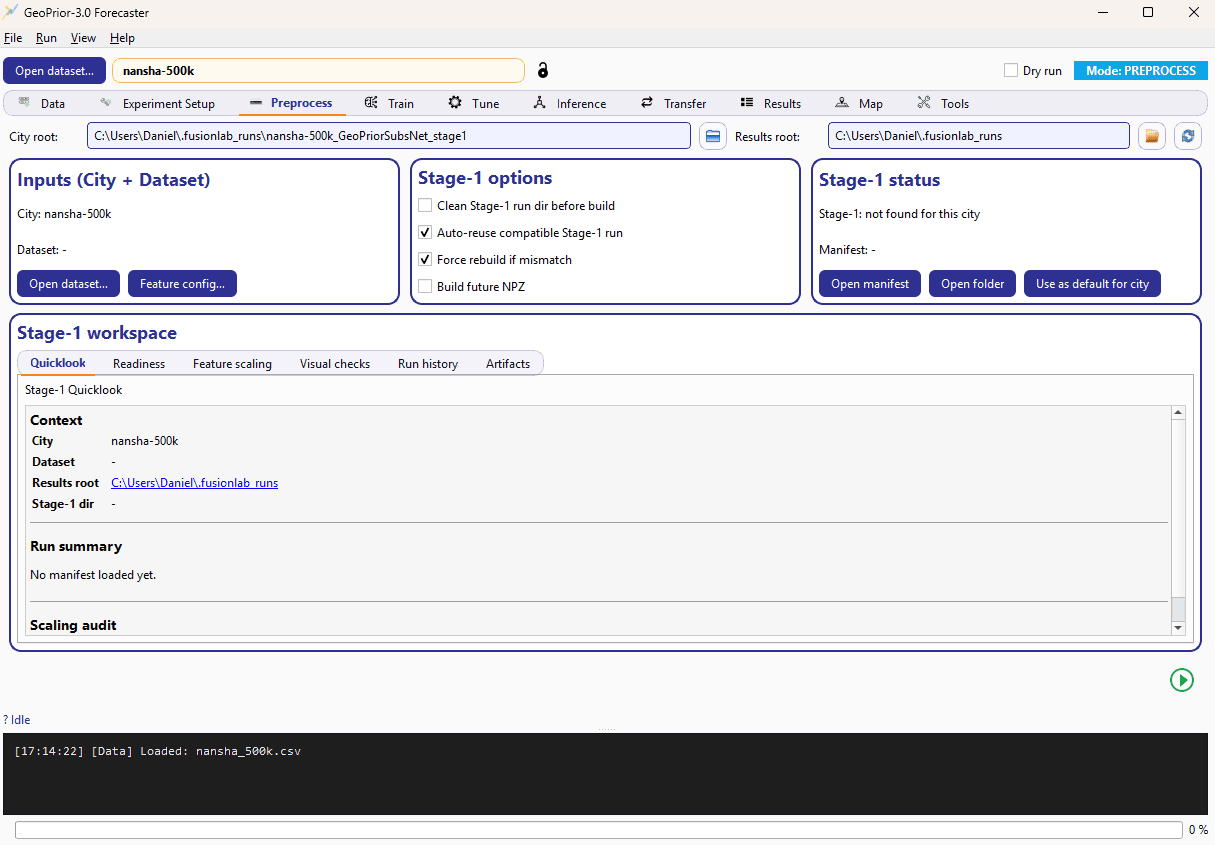
Preprocess control
A visible preparation layer for data harmonization before model execution.
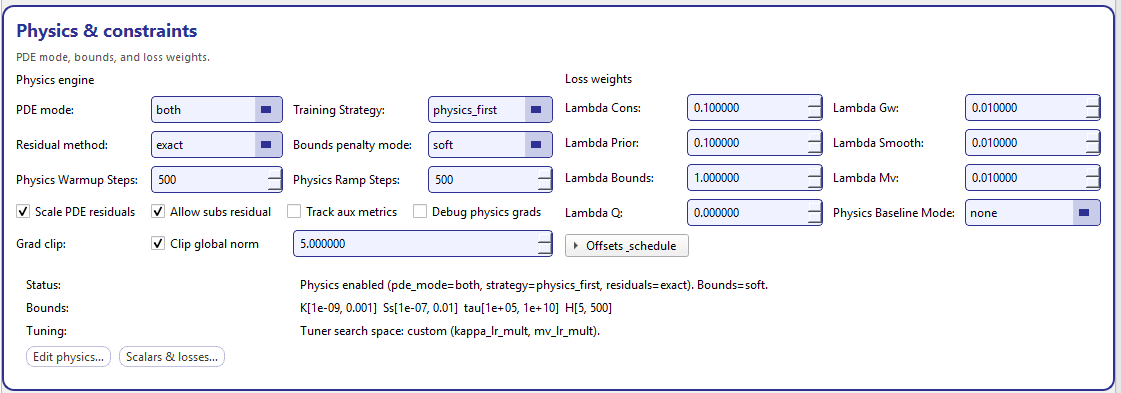
Physics constraints
Choose the PDE mode, residuals, bounds and loss weights that keep every forecast physically consistent.
City demo
Want to discuss a real urban resilience use case?
A city-focused demo goes further: where subsidence risk concentrates, how scenarios evolve, and what it means for planning decisions.