Interpretable Uncertainty Diagnostics
Making probabilistic forecasts transparent and decision-ready with a novel visual analytics framework.
The Problem: Hidden Risks
Standard forecast metrics average out performance, hiding dangerous clusters of errors. A model can look good on paper but fail repeatedly when it matters most, leading to depleted resources and broken trust.
My Innovations
I developed two solutions: the CAS score to quantify the risk of error bursts, and the k-diagram toolkit to visualize and diagnose the complex structure of forecast uncertainty.
The CAS Score: Measuring What Matters
Instead of treating all errors equally, the Cluster-Aware Severity (CAS) score penalizes failures based on their context.
Identify a Failure
An observation (black dot) falls outside the predicted interval (gray band).
Measure Local Density
The system checks if other failures have occurred recently within a defined window.
Assign Severity Score
Clustered failures receive a higher penalty than isolated misses, better reflecting real-world operational risk.
k-diagram: A Visual Analytics Toolkit
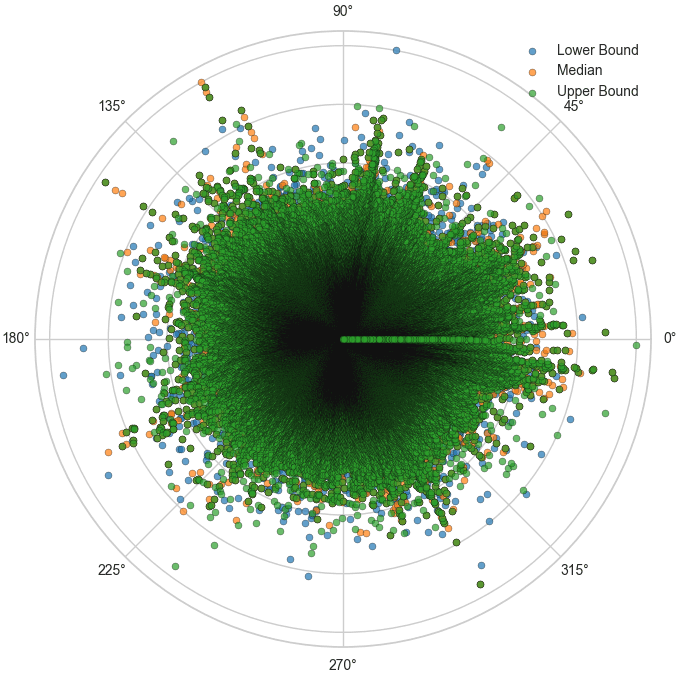
To build trust, decision-makers need to see uncertainty. The k-diagram toolkit uses novel polar plots to answer key diagnostic questions.
"Where is the model failing?"
The Anomaly Magnitude diagram maps the location and severity of prediction interval failures, revealing systematic biases.
"How does accuracy decay?"
The Forecast Horizon Drift plot visualizes how a model's precision degrades as it predicts further into the future.
"What is the shape of the error?"
Polar violins provide a unique way to compare the full error distributions of multiple models at a glance.
Summary of Contributions
- Why averages mislead: single scores hide clustered failures that drive real-world risk.
- Risk-focused evaluation: the CAS score highlights resilience by penalizing dangerous error bursts.
- Clear uncertainty visualization: k-diagram’s polar views reveal blind spots and horizon drift to guide decisions.
- Building trust in AI: transparent, visual diagnostics create a shared language between modelers and practitioners.
Related publications
- k-diagram: Rethinking Forecasting Uncertainty via Polar-Based VisualizationKouadio, K. L. · In preparation — Journal of Open Source Software (JOSS) · 2025
- k-diagram: Technical Report — Derivations and DetailsKouadio, K. L. · Zenodo (Technical Report) · 2025